
 Back Home
October Sales Stats – Dane County & Verona
Every fall the real estate market calms, both in terms of sales and median prices. You can clearly see the seasonal cycles in the Median Price Annual Comparison chart below. This is partly due to less buyer demand this time of year, and partly due to fewer high end homes hitting the market in the Fall/Winter seasons. However, Spring prices tend to recover to exceed the prior year, and these lines rarely cross. The last time these lines crossed was July 2015 when median prices dipped below July of 2014. I should note that this chart tracks single family homes and condos. If we look at both property classes the median Dane County price is still up 3.9% this October over October 2022. If we only look at single family sales though, these lines actually touch in October (they cross by $50, but we’ll call it even).
This tells me two key things. 1) Condos are hotter than they where last year, and that make sense because it’s what people can afford with the current rates. 2) Interest rates are now having a strong effect on the market, and we are seeing more than just seasonal variations.
One more point on prices and rates before I move on… Mortgage rates hit a 23 year high in October (so this data is not a surprise), but rates have since pulled back about 1/2% the beginning of November. We usually see a 30-60 day lag in data because that’s how long it typically is from offer to closing. I’d expect November’s data is similar or even worse, but I’m curious if December and January show improvement. Only time will tell. 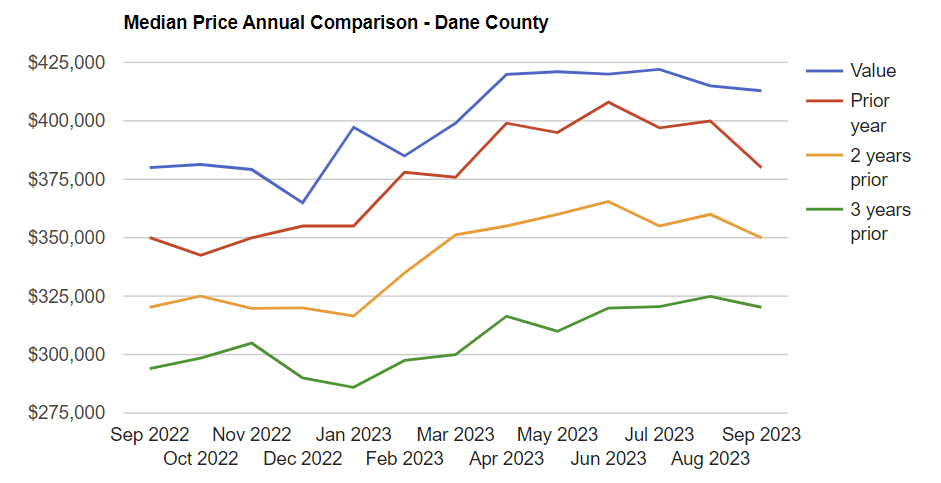
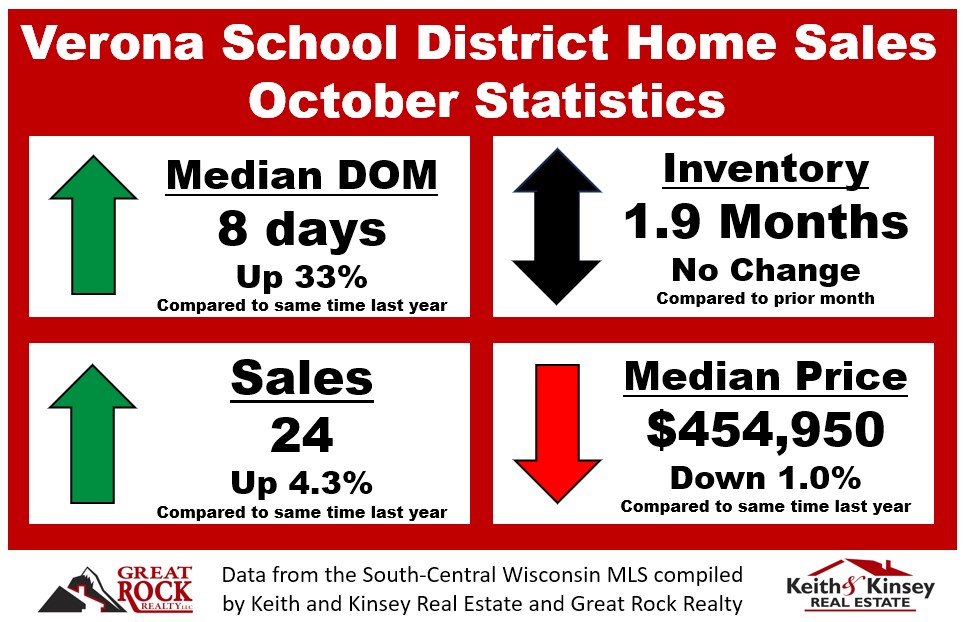
Other October data shows inventory has creeped up just slightly in Dane County and remains unchanged in Verona. It’s still low and in the seller’s favor. If rates do pull back further (especially if that happens close to Spring) be prepared for a buying frenzy again.
Sales are still down county wide over last year (up slightly in Verona), but we are approaching that leveling point (where sales slowed last year).
Median days on market looks like a significant change by percentage, but we are really only talking a day or 2. Although, days on market for active listings is up to 43 days, so look for this number to increase significantly on closings in the coming months. That’s good news for buyers as they can think through a major decision rather than make it on the spot. A good properly priced home is still selling in a very reasonable time frame. Historically speaking if you sell your house in a month and a half, that’s fast. We’ve just gotten abnormally accustomed to immediate sales. 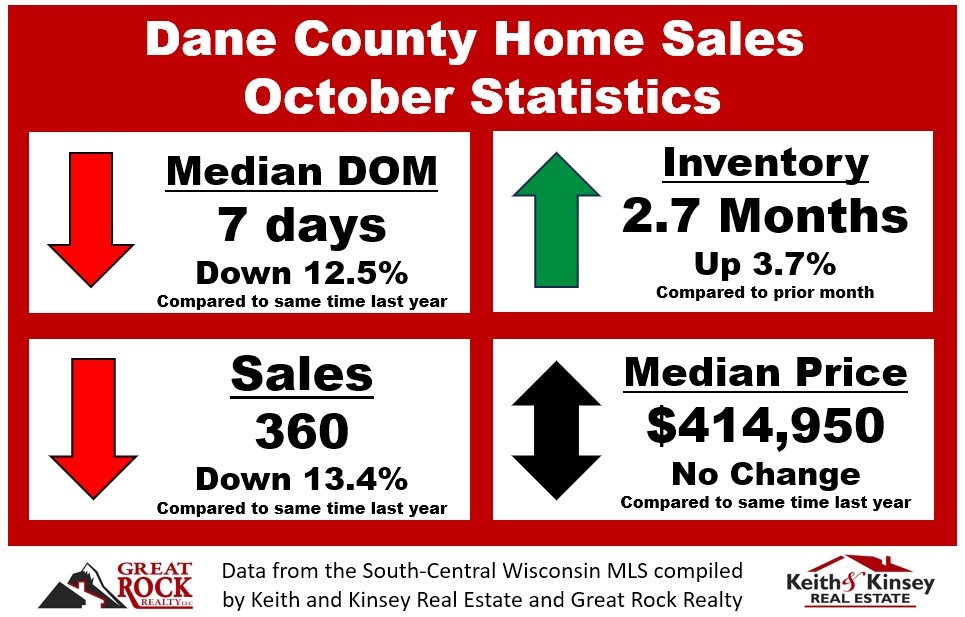
Everybody wants to know, what’s going to happen 6 months from now. I’ve heard a number of people say they are waiting for the crash to buy. I kind of wish that would happen to make it easier for us to buy some more investment properties (and easier for our buyers), but I don’t think we’ll see a crash anytime soon. Maybe it’s my optimism for real estate, but here’s why I don’t think it will happen even though affordability is ridiculously low:
- Supply and demand is still at too big of an imbalance.
- We are way below the average historical foreclosure rate.
- Homeowners are sitting on 3% mortgages, and don’t want/need to sell.
Do I think we could see prices dip a few percent over last year, yes, but will we see a 10% or greater crash, absolutely not. I think rates are close to a plateau, and I’m actually a little worried a premature pull back in rates will make things go crazy again. Right now is a great buying opportunity with minimal competition among buyers, and better rates than last month. Take advantage of the timing.
Here’s the homes that sold in Verona October 2023
| Sale Date | Address | # Bed | # Bath | Year Built | Days on Mkt | Sq Ft | Price/SF | List Price | Sale Price |
| 10/24/2023 | 407 S Main Street | 3 | 1 | 1900 | 5 | 1,008 | $317.46 | $320,000 | $320,000 |
| 10/20/2023 | 4521 Jenewein Road | 3 | 3 | 1978 | 51 | 2,049 | $165.93 | $354,900 | $340,000 |
| 10/31/2023 | 408 Edward Street | 3 | 1.5 | 1966 | 9 | 1,328 | $264.98 | $349,900 | $351,900 |
| 10/16/2023 | 2500 SPARK Street | 2 | 2.5 | 2023 | 0 | 1,403 | $260.09 | $364,900 | $364,900 |
| 10/20/2023 | 2406 Red Arrow Trail | 3 | 2.5 | 2006 | 13 | 2,122 | $179.03 | $379,900 | $379,900 |
| 10/12/2023 | 4618 New Freedom Lane | 3 | 2.5 | 2006 | 34 | 1,953 | $199.69 | $387,500 | $390,000 |
| 10/5/2023 | 420 S Main Street | 3 | 2 | 1910 | 48 | 1,731 | $231.08 | $399,900 | $400,000 |
| 10/20/2023 | 1031 Range Trail | 3 | 2.5 | 2021 | 19 | 2,079 | $192.40 | $405,000 | $400,000 |
| 10/30/2023 | 1261 Early Twilight Way | 3 | 2.5 | 2022 | 51 | 1,510 | $268.21 | $415,000 | $405,000 |
| 10/27/2023 | 2661 Richardson Street | 3 | 3 | 1988 | 6 | 1,931 | $210.77 | $385,000 | $407,000 |
| 10/20/2023 | 304 Schweitzer Drive | 3 | 2 | 1977 | 5 | 1,894 | $219.11 | $415,000 | $415,000 |
| 10/2/2023 | 2501 Spark Street | 3 | 2.5 | 2023 | 28 | 1,615 | $266.19 | $429,900 | $429,900 |
| 10/31/2023 | 421 Military Ridge Drive | 4 | 3.5 | 1999 | 5 | 2,596 | $184.90 | $480,000 | $480,000 |
| 10/23/2023 | 835 Cheshire Castle Way | 3 | 3 | 2009 | 20 | 1,978 | $242.67 | $484,900 | $480,000 |
| 10/20/2023 | 309 Westridge Parkway | 4 | 3 | 2000 | 2 | 2,642 | $185.47 | $484,900 | $490,000 |
| 10/3/2023 | 135 Westridge Parkway | 4 | 3 | 1999 | 10 | 2,777 | $178.25 | $499,900 | $495,000 |
| 10/24/2023 | 1261 Merry Blossom Lane | 3 | 2.5 | 2023 | 0 | 1,876 | $273.18 | $512,490 | $512,490 |
| 10/31/2023 | 857 E Whispering Pines Way | 3 | 2 | 2023 | 0 | 1,816 | $302.63 | $549,568 | $549,568 |
| 10/23/2023 | 1267 Merry Blossom Lane | 3 | 2.5 | 2023 | 0 | 2,452 | $236.25 | $579,279 | $579,279 |
| 10/25/2023 | 908 E Whispering Pines Way | 4 | 2.5 | 2023 | 20 | 2,052 | $285.04 | $584,900 | $584,900 |
| 10/31/2023 | 969 Pollow Road | 3 | 2.5 | 2019 | 4 | 2,328 | $283.51 | $625,000 | $660,000 |
| 10/26/2023 | 324 Westridge Parkway | 4 | 3.5 | 1999 | 8 | 3,321 | $200.84 | $640,000 | $667,000 |
| 10/23/2023 | 1104 Acker Lane | 5 | 4 | 2016 | 21 | 3,921 | $184.90 | $725,000 | $725,000 |
| 10/23/2023 | 1720 Range Trail | 3 | 2.5 | 1976 | 5 | 2,418 | $310.17 | $699,900 | $750,000 |


Leave a Reply
You must be logged in to post a comment.