
 Back Home
Verona Home Sales Statistics – October 2015
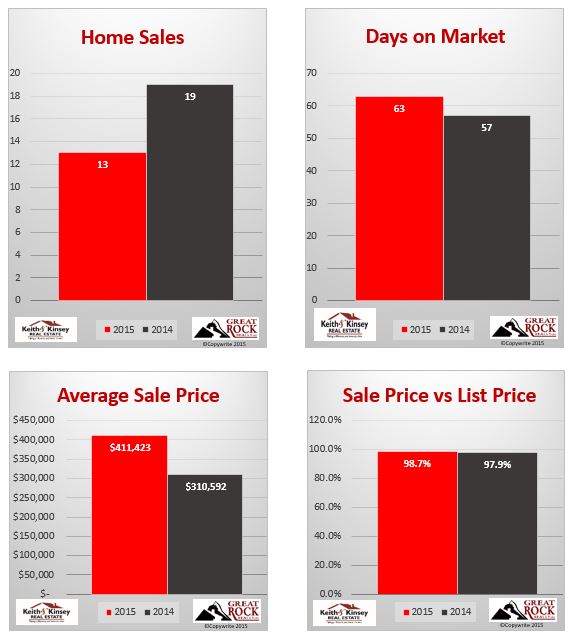
It was a strong summer for Verona housing, but it was somewhat week for the higher end homes. However, September and especially October turned that around! October posted a $100,000 increase in average price over the same time period last year! That is not to say the market went up that much, the Verona market is small enough that a few big sales can skew the averages. This increase in average sale price was due to several $400,000+ houses selling last month in Cathedral Point.
The sale price to list price ratio was still strong at 98.7%, but the average time on market jumped up to 63 days. It’s kind of expected that the number of days on market increases this time of year. However, this is also partially a result of increased inventory. We’ve seen a rise in inventory for several months straight now. We’ve jumped from 3.2 months of inventory in July to 4.2 months of inventory in October. This means we are in a more balanced market now, but it’s still to the sellers favor.
Cathedral Point remains the most active neighborhood with 5 houses closed and an average of 17 days on the market.
Verona, WI October Home Sales Summary
Verona, WI October Home Sales By Neighborhood
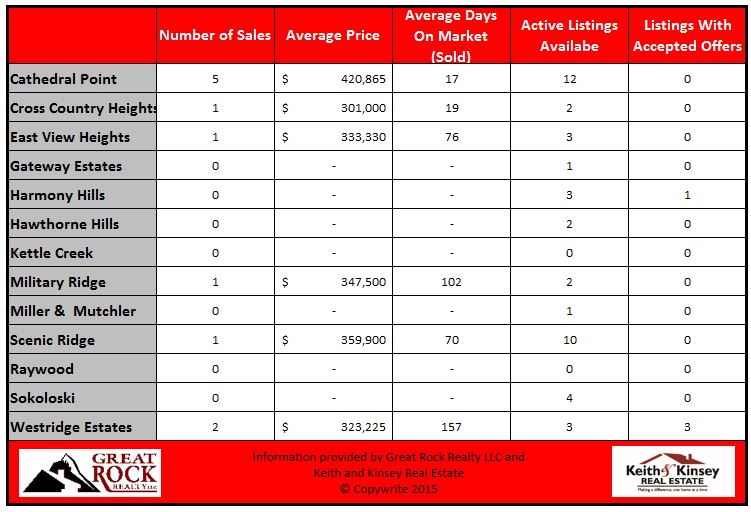
If the neighborhood you live in is not on this list, sorry. We chose the 13 most active neighborhoods in Verona over the last year. We also do a lot of work in Middleton, Mount Horeb, Oregon, Belleville and Madison. We’d be happy to dig up information on your neighborhood if you contact us directly.


Leave a Reply
You must be logged in to post a comment.