Back Home
Verona Home Sales Statistics – September 2015
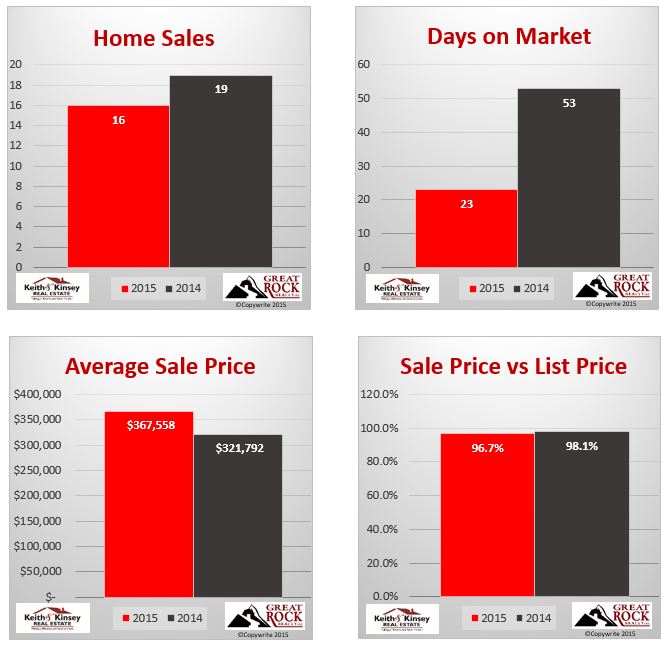
 It’s that time of year when the kids are back in school, it’s getting colder out, and fewer people are moving. The number of sales has dropped off a little bit over the past couple months in Verona, but it’s still a strong market. We saw an interesting change this month with a big jump in average sale price over last month and the same period last year. This supports the fact that prices are going up, but it also means that several of the recent sales were some of the higher end more expensive homes. This is good news, because if you read last months statistics I noted that the more expensive neighborhoods had been moving slower.
The sale price to list price ratio was down a little bit to 96.7%, but that’s not unexpected when more expensive homes are moving. The average time on the market actually dropped to 23 days, and inventory creeped up to 3.7 months with 68 available listings. All this data tells us it’s still a great market for selling homes.
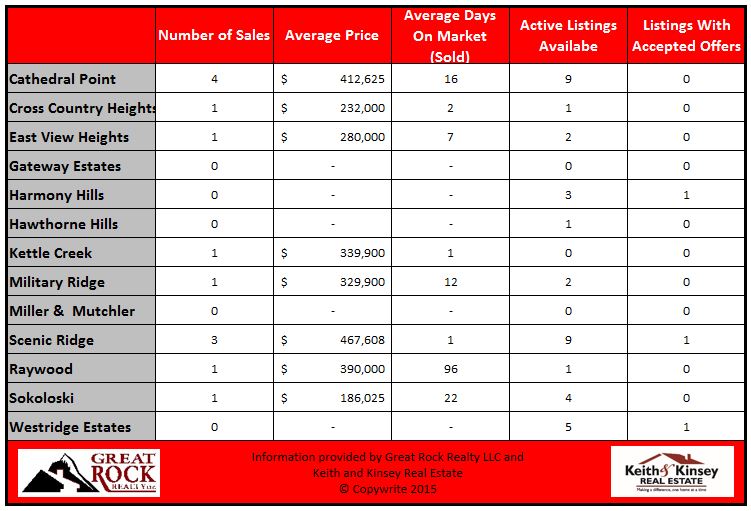
Cathedral Point remains the most active neighborhood with 4 houses closed, and believe it or not Kettle Creek and Scenic Ridge had homes sell within 1 day of being on the market!
Verona, WI August Home Sales Summary
Verona, WI August Home Sales By Neighborhood